Nexus Analytics
Nexus provides comprehensive content analytics to provide valuable insight into the visitor data and browsing patterns. It turns raw user clicks into clear facts. All analytics data is stored on Paligo servers (anonymized).
Enable Nexus analytics
By default, Analytics are not turned on when a Nexus project is created. To enable Analytics:
Select Nexus in the top menu. You are presented with the list of current Nexus projects.

Access the project you want to configure by selecting it in the list.
Select the Analytics tab.
Select the On/Off toggle for the analytics. The analytics will be turned on in a few seconds.

Note
A publication connected to this project needs to be republished in order for analytics to start taking effect.
Analytics time interval
You can set the time interval for which the analytics are displayed.
In the Analytics tab, just select the time period you want to view using the dropdown.
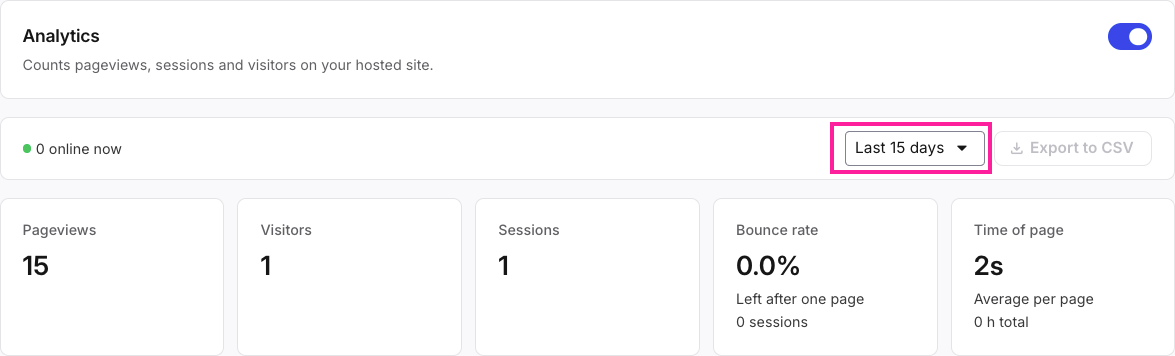 |
The following preset time intervals are available:
Last 24 hours
Last 7 days
Last 15 days
Last 30 days
Last 3 months
Last 6 months
Set a custom date range for Analytics
You can set your own start and end date as the time interval for viewing the Anaytics of a project.
Select Nexus in the top menu. You are presented with the list of current Nexus projects.
Access the project you want to configure by selecting it in the list.
Select the Analytics tab.
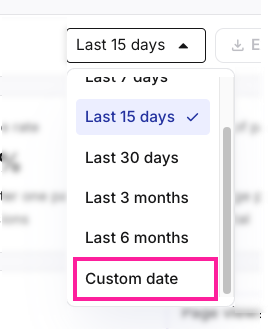
Select the time interval dropdown and from the list select Custom date.
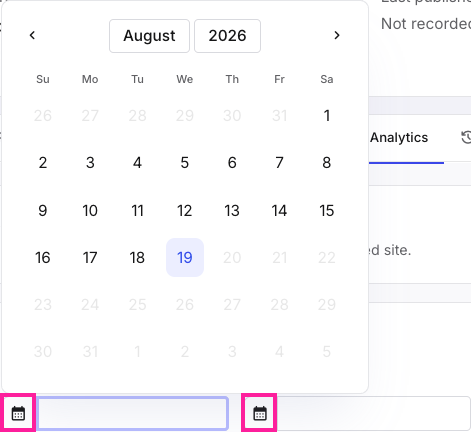
Enter a start date in the From field, and an end date in the To field, using the date picker.
Analytics overview
Note
Mentions of “the specified time period” in the table below refers to the time interval set for the analytics. See Analytics time interval above.
Metric | Description |
Page views | Counts the total number of times a page on a website was loaded or reloaded in a browser, over the specified time period. It measures activity , not people. |
Visitors | Counts the number of distinct individuals who access a website or app over the specified time period. |
Sessions | Counts the number of distinct interaction periods a visitor has with the website within the specified time period. A single visitor can have multiple sessions over time. |
Bounce rate | Counts sessions/visits in which a visitor left the site after viewing only one page (or interacting only minimally). This metric also indicates the number of visitors that left after viewing only one page. |
Total time | Raw aggregate of the amount of time visitors spent actively engaged across a set of sessions, pages, or a given reporting period. |
Traffic over time | Graphic showing the plots the Page views or Sessions metric across the specified time period. You can choose between Page views and Sessions by using the toggle switch at the right of the section. |
Top pages | List of the individual pages on a site ranked by traffic volume. Indicates total absolute number as well as share of the total in percentage for every entry. |
Referrers | Lists the external websites sending the most traffic to your site, ranked by sessions or visits generated from each source. |
Countries | List of site traffic by the visitor's geographic country of origin. |
Devices | List of ite traffic by the type of hardware visitors used. |
Browsers | List of site traffic by which web browser (Chrome, Safari, Firefox, Edge, etc.) visitors used to access the site. |
Operating systems | List of site traffic by the OS running on the visitor's device (Windows, macOS, iOS, Android, Linux, etc.). |
Export analytics data
Not available yet.