Dashboard
When you first log in to Paligo, the Dashboard is shown. It provides you with an overview of your Paligo instance and the assignments you need to work on. The Dashboard contains several panels described below.
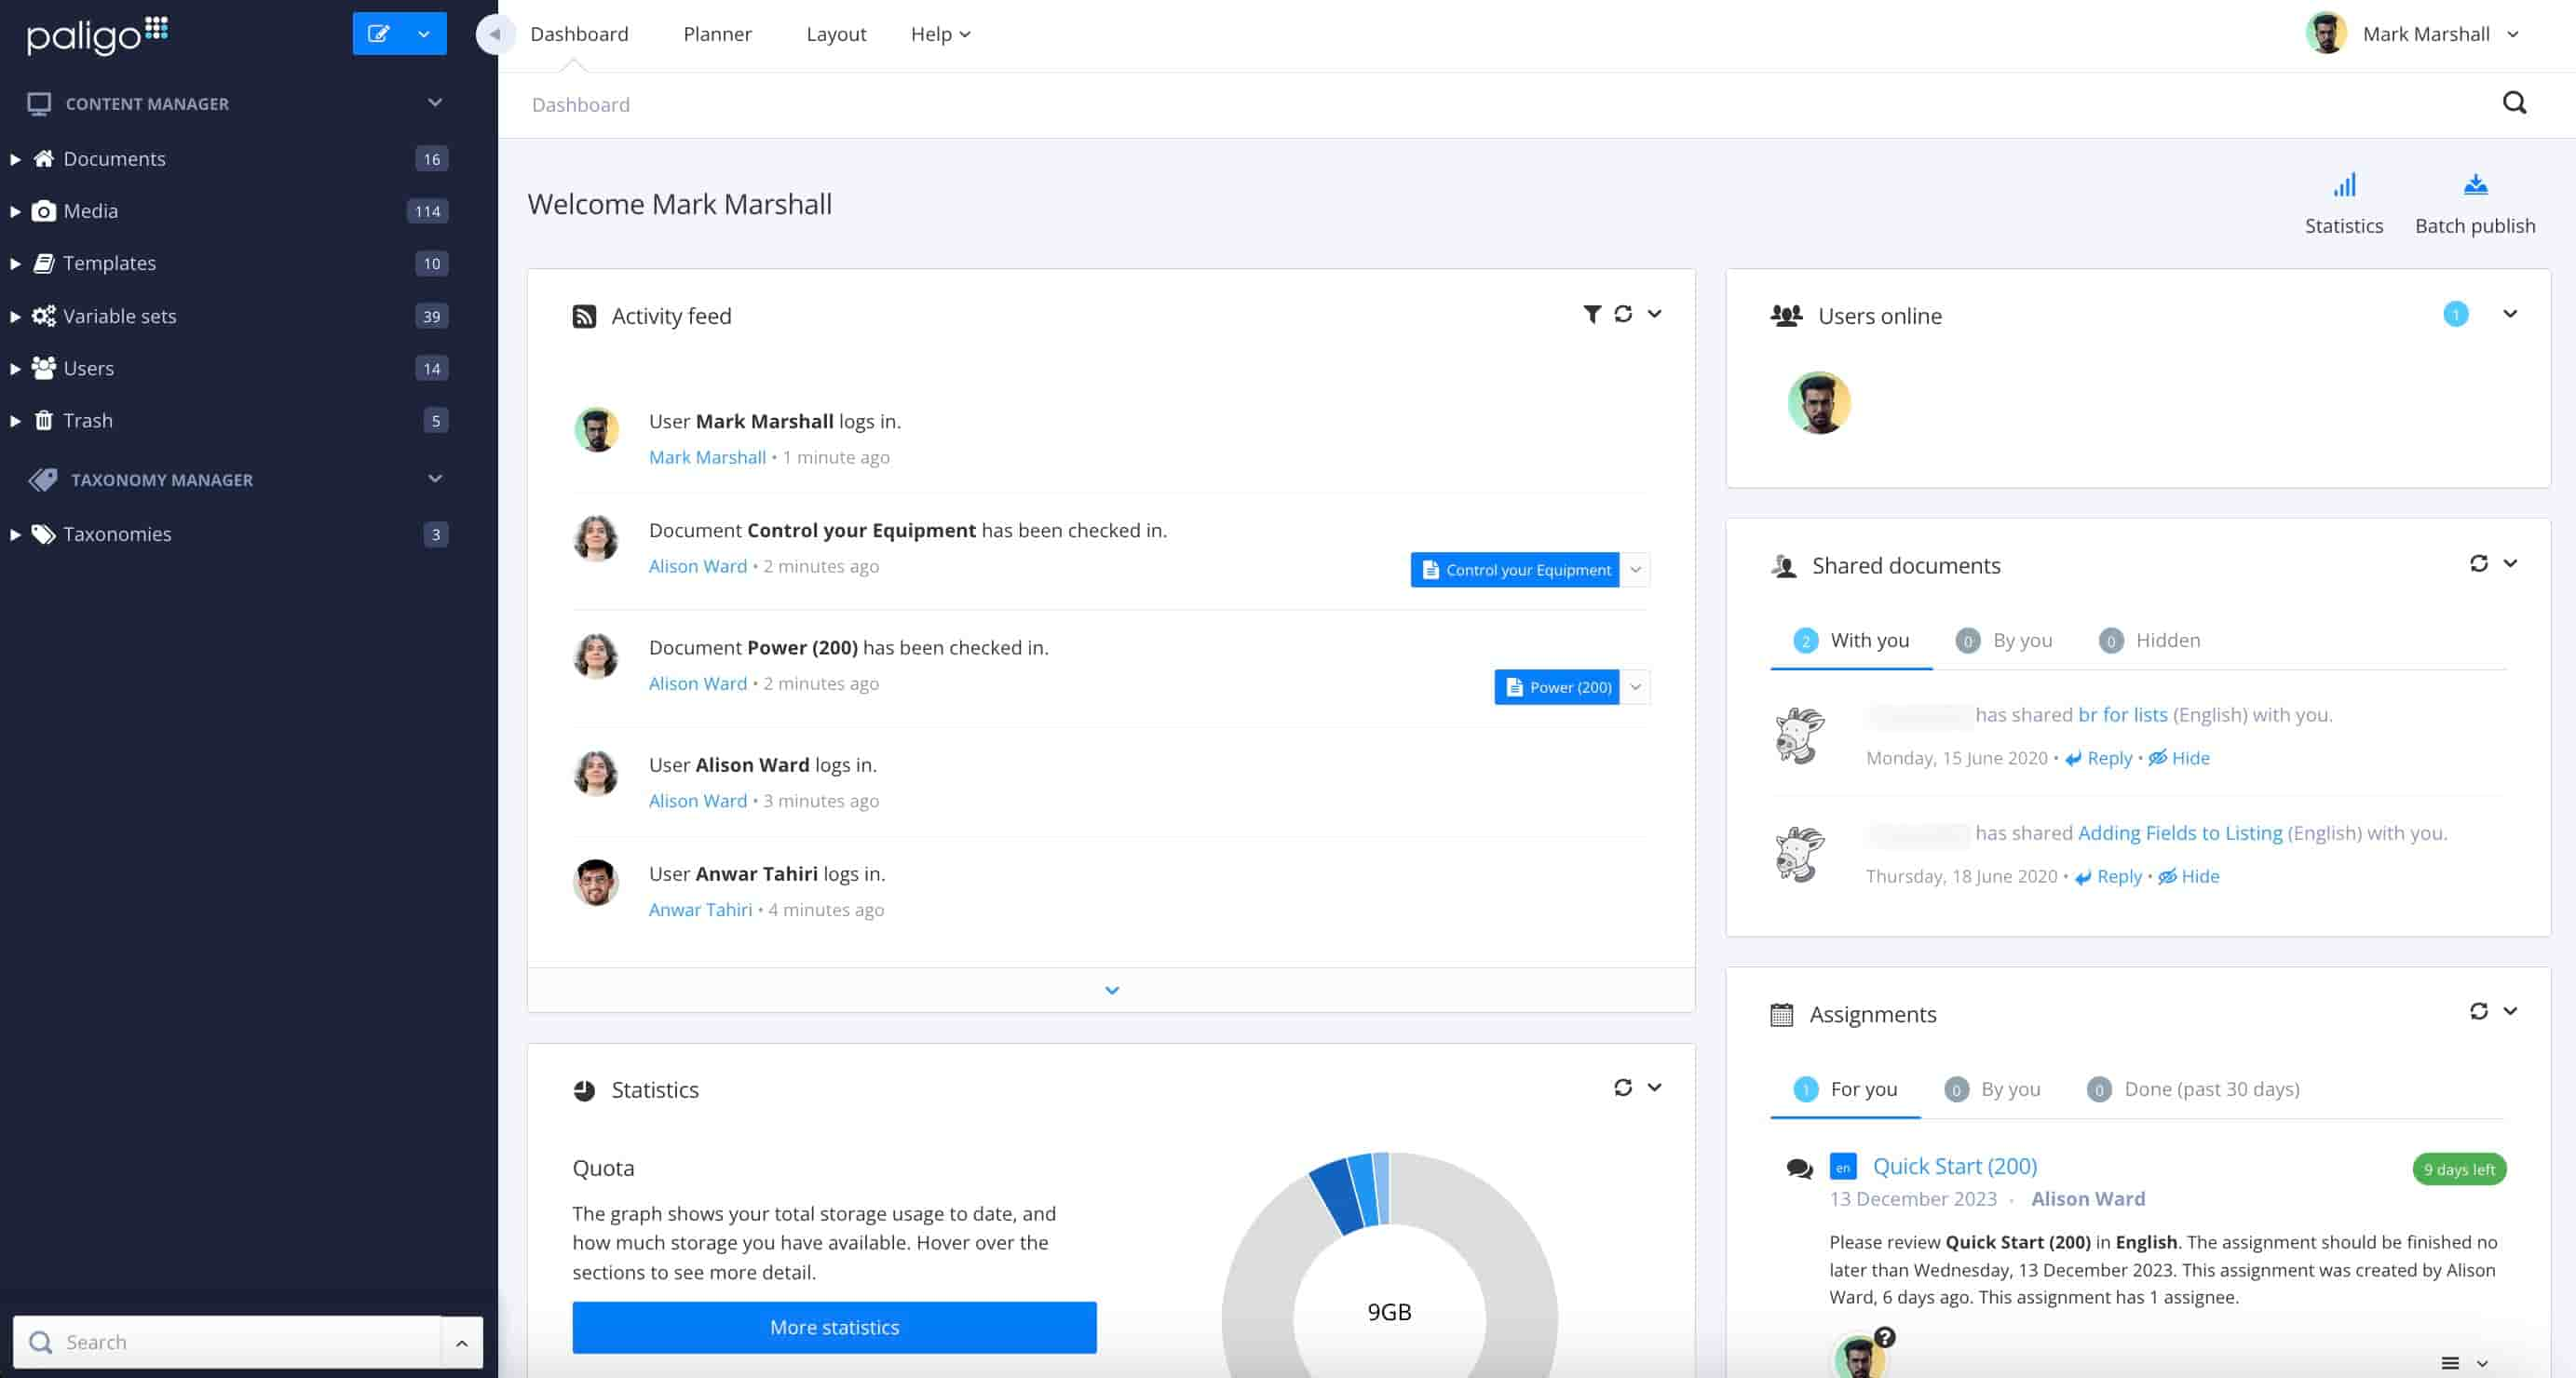 |
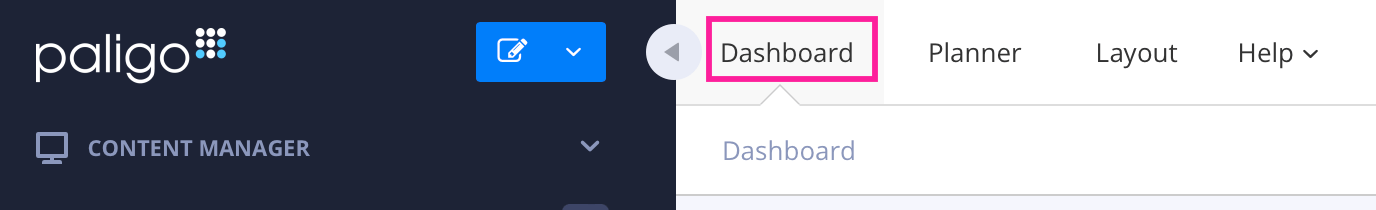
If you have navigated away from the Dashboard, you return to it by selecting the Dashboard tab in the top menu.
 |
Note
Content Manager is shown in the left sidebar. You will use the Content Manager when creating and organizing your content. The Taxonomy Manager is also in the left sidebar.
The Activity Feed panel shows a history of recent events in your Paligo instance. These include users logging in, creating topics, editing and deleting topics.
For each event (except login), you can choose to display it in the Editor or to locate it in the Content Manager. By clicking the topic's blue highlight, it will be shown in the Resource View.
By default, the Activity Feed shows the five most recent events. Select the down arrow icon at the bottom of the Activity Feed panel to see more.
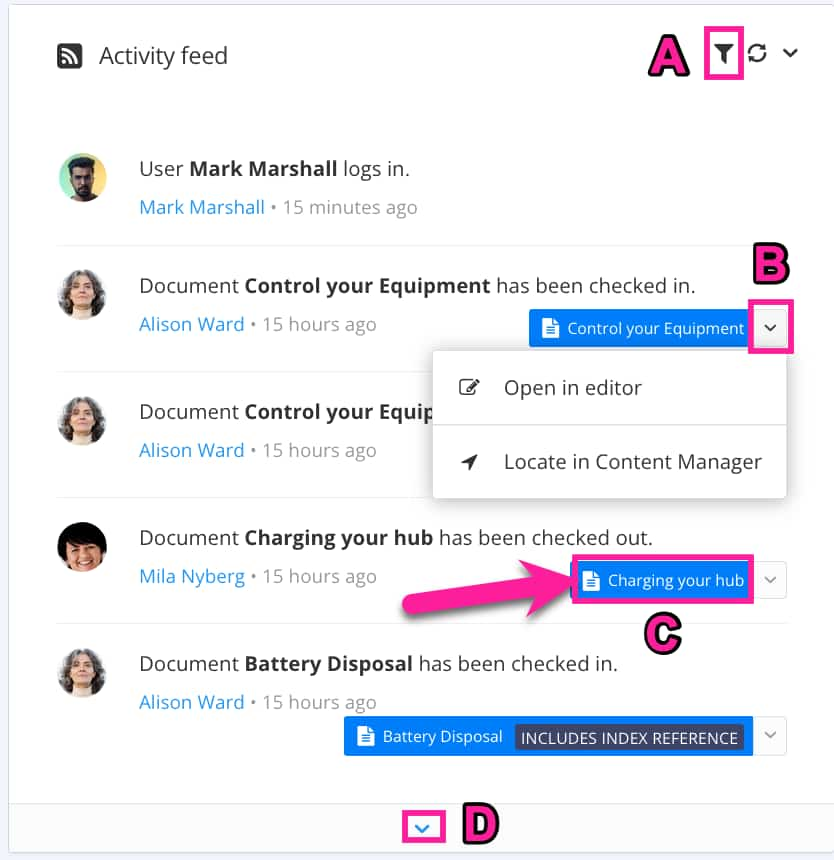 |
Event options: Open in Editor or Locate in Content Manager
Use the blue highlight to show the topic in the Resource View
Show more events with this arrow.
The dashboard has an activity feed where you can see a record of recent events in your Paligo instance.
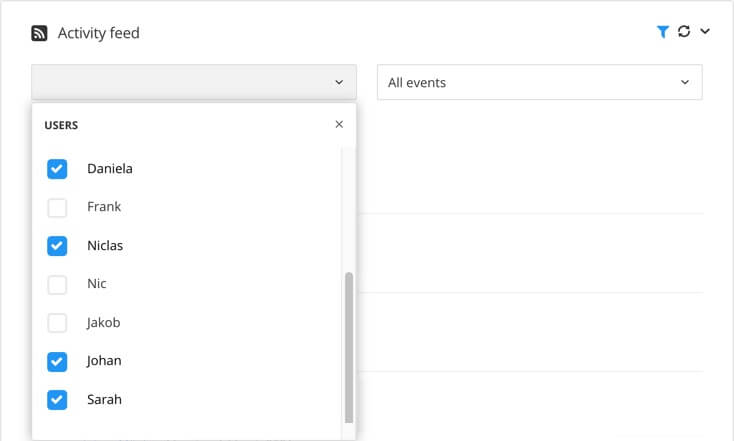
By default, the activity feed shows all traceable events, the time of each event, and the users involved, but you can filter it to only show user activity and events of interest to you.
Note
By default, all boxes are cleared. This has the same effect as all boxes being checked - no filters are applied. With a mix of selected and deselected checkboxes, only the selected options are shown.
Select Dashboard in the top menu.
Select the filter icon in the Activity Feed section.

Select the column All users:
Check the boxes for the users you want to include in your activity feed.
Clear the boxes for the users to be excluded from your activity feed.
Note
All boxes are clear by default and this has the same effect as all boxes being checked - no filters are applied. But when you have a mix of cleared and checked boxes, the cleared users are not shown in the activity feed, the checked users are shown.
Select the column All events:
Check the boxes for the events you want to include in your activity feed.
Clear the boxes for the events to be excluded from your activity feed.
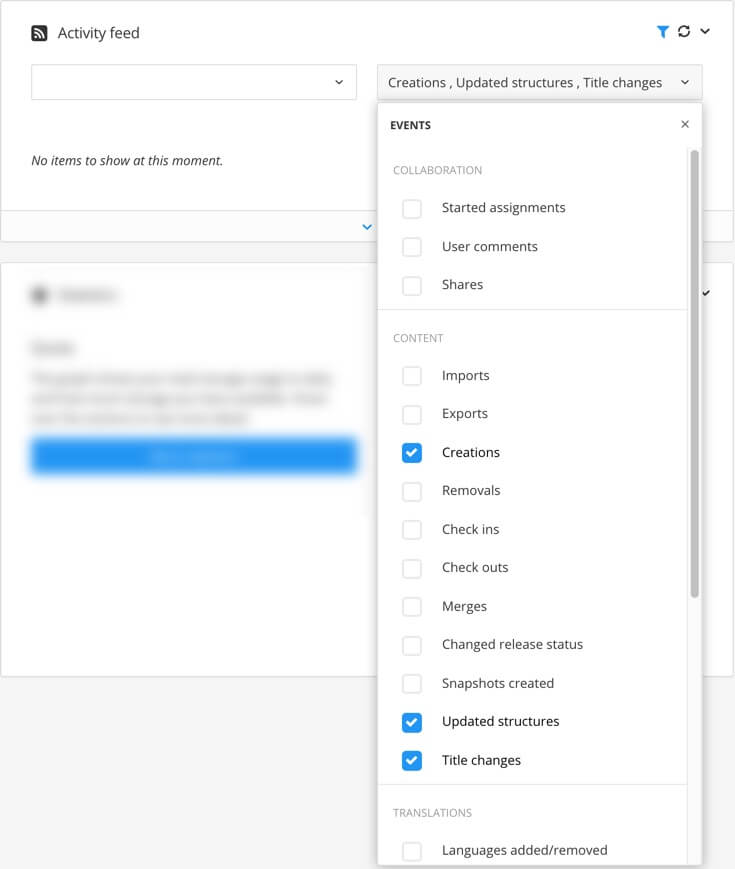
The events are organized into categories to make it easier to find what you are looking for.
Paligo immediately updates the activity feed to show the selected the content.
Tip
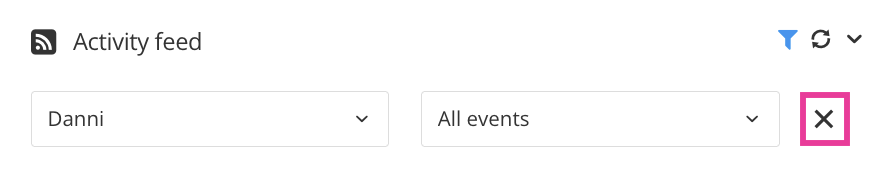
To remove the activity feed filters with a single click, select the X to the right of the filtering.
 |
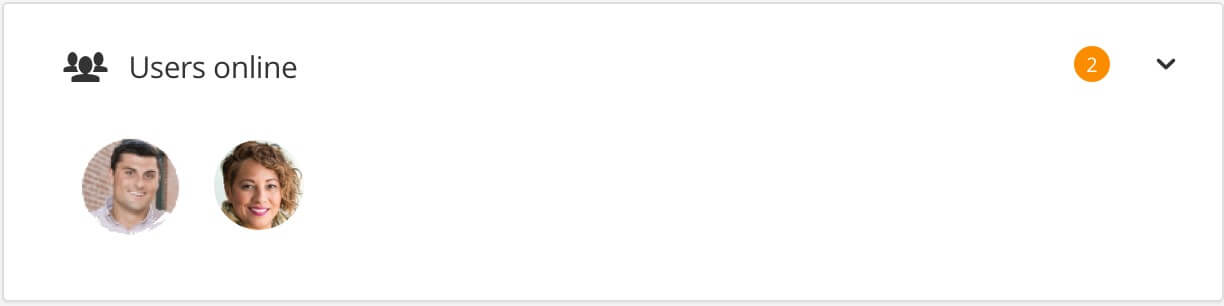
The Users Online panel shows you which users are currently logged in to your Paligo instance. You can see the profile image for each logged in user and the total number of logged in users is shown in a circle in the top corner.
 |
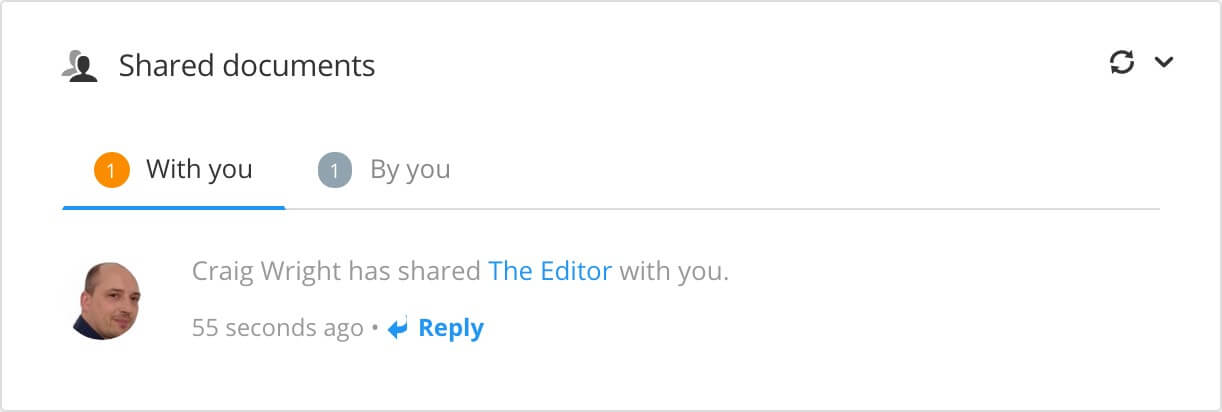
You can share a document, such as a topic or publication, with other users so that they can make a contribution. The Shared Documents panel has two tabs: With You and By You.
The With you tab shows you who has shared a document with you, and provides a link to the document. You can also send a reply to the user who shared the document.
 |
The By you tab shows the documents you have shared with other users. You have the option to cancel the share (Unshare) or to edit the share. When you edit the share, you can change the timescale, add a different message, etc.
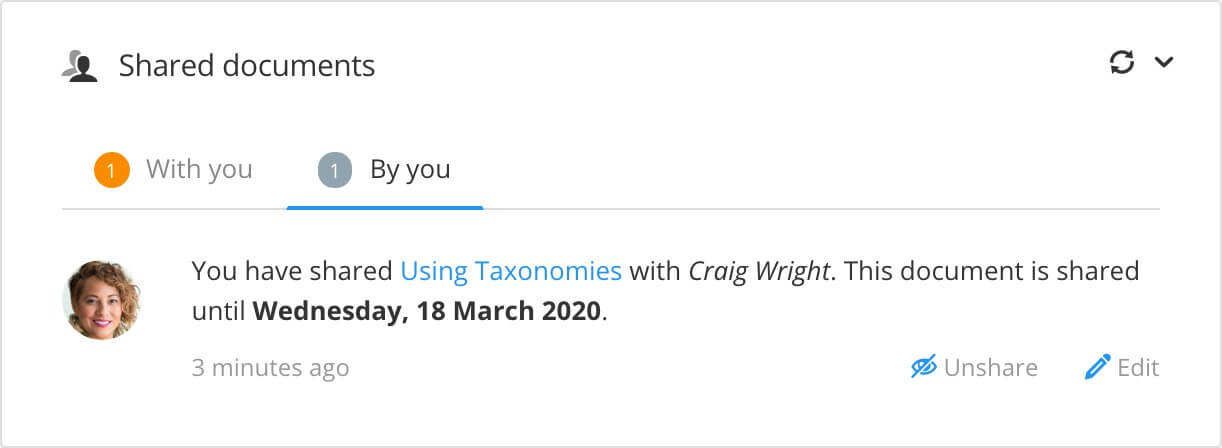 |
Tip
For more information on sharing documents, see Share Content (without assignments).
In Paligo, you can create assignments for various Assignment Types. An assignment is a request to work on content within a time frame.
The Assignments Panel shows links to your assignments and due dates. Selecting an assignment link will open the Review View, Translation View or Edit View depending on the assignment type.
When the assignment is created an email notification is sent to the assignee containing a link to the assignment. This link also appears in the Assignments panel.
When the assignment is done an email notification is sent to the author with a link to the assignment. This link also appears in the Assignments panel.
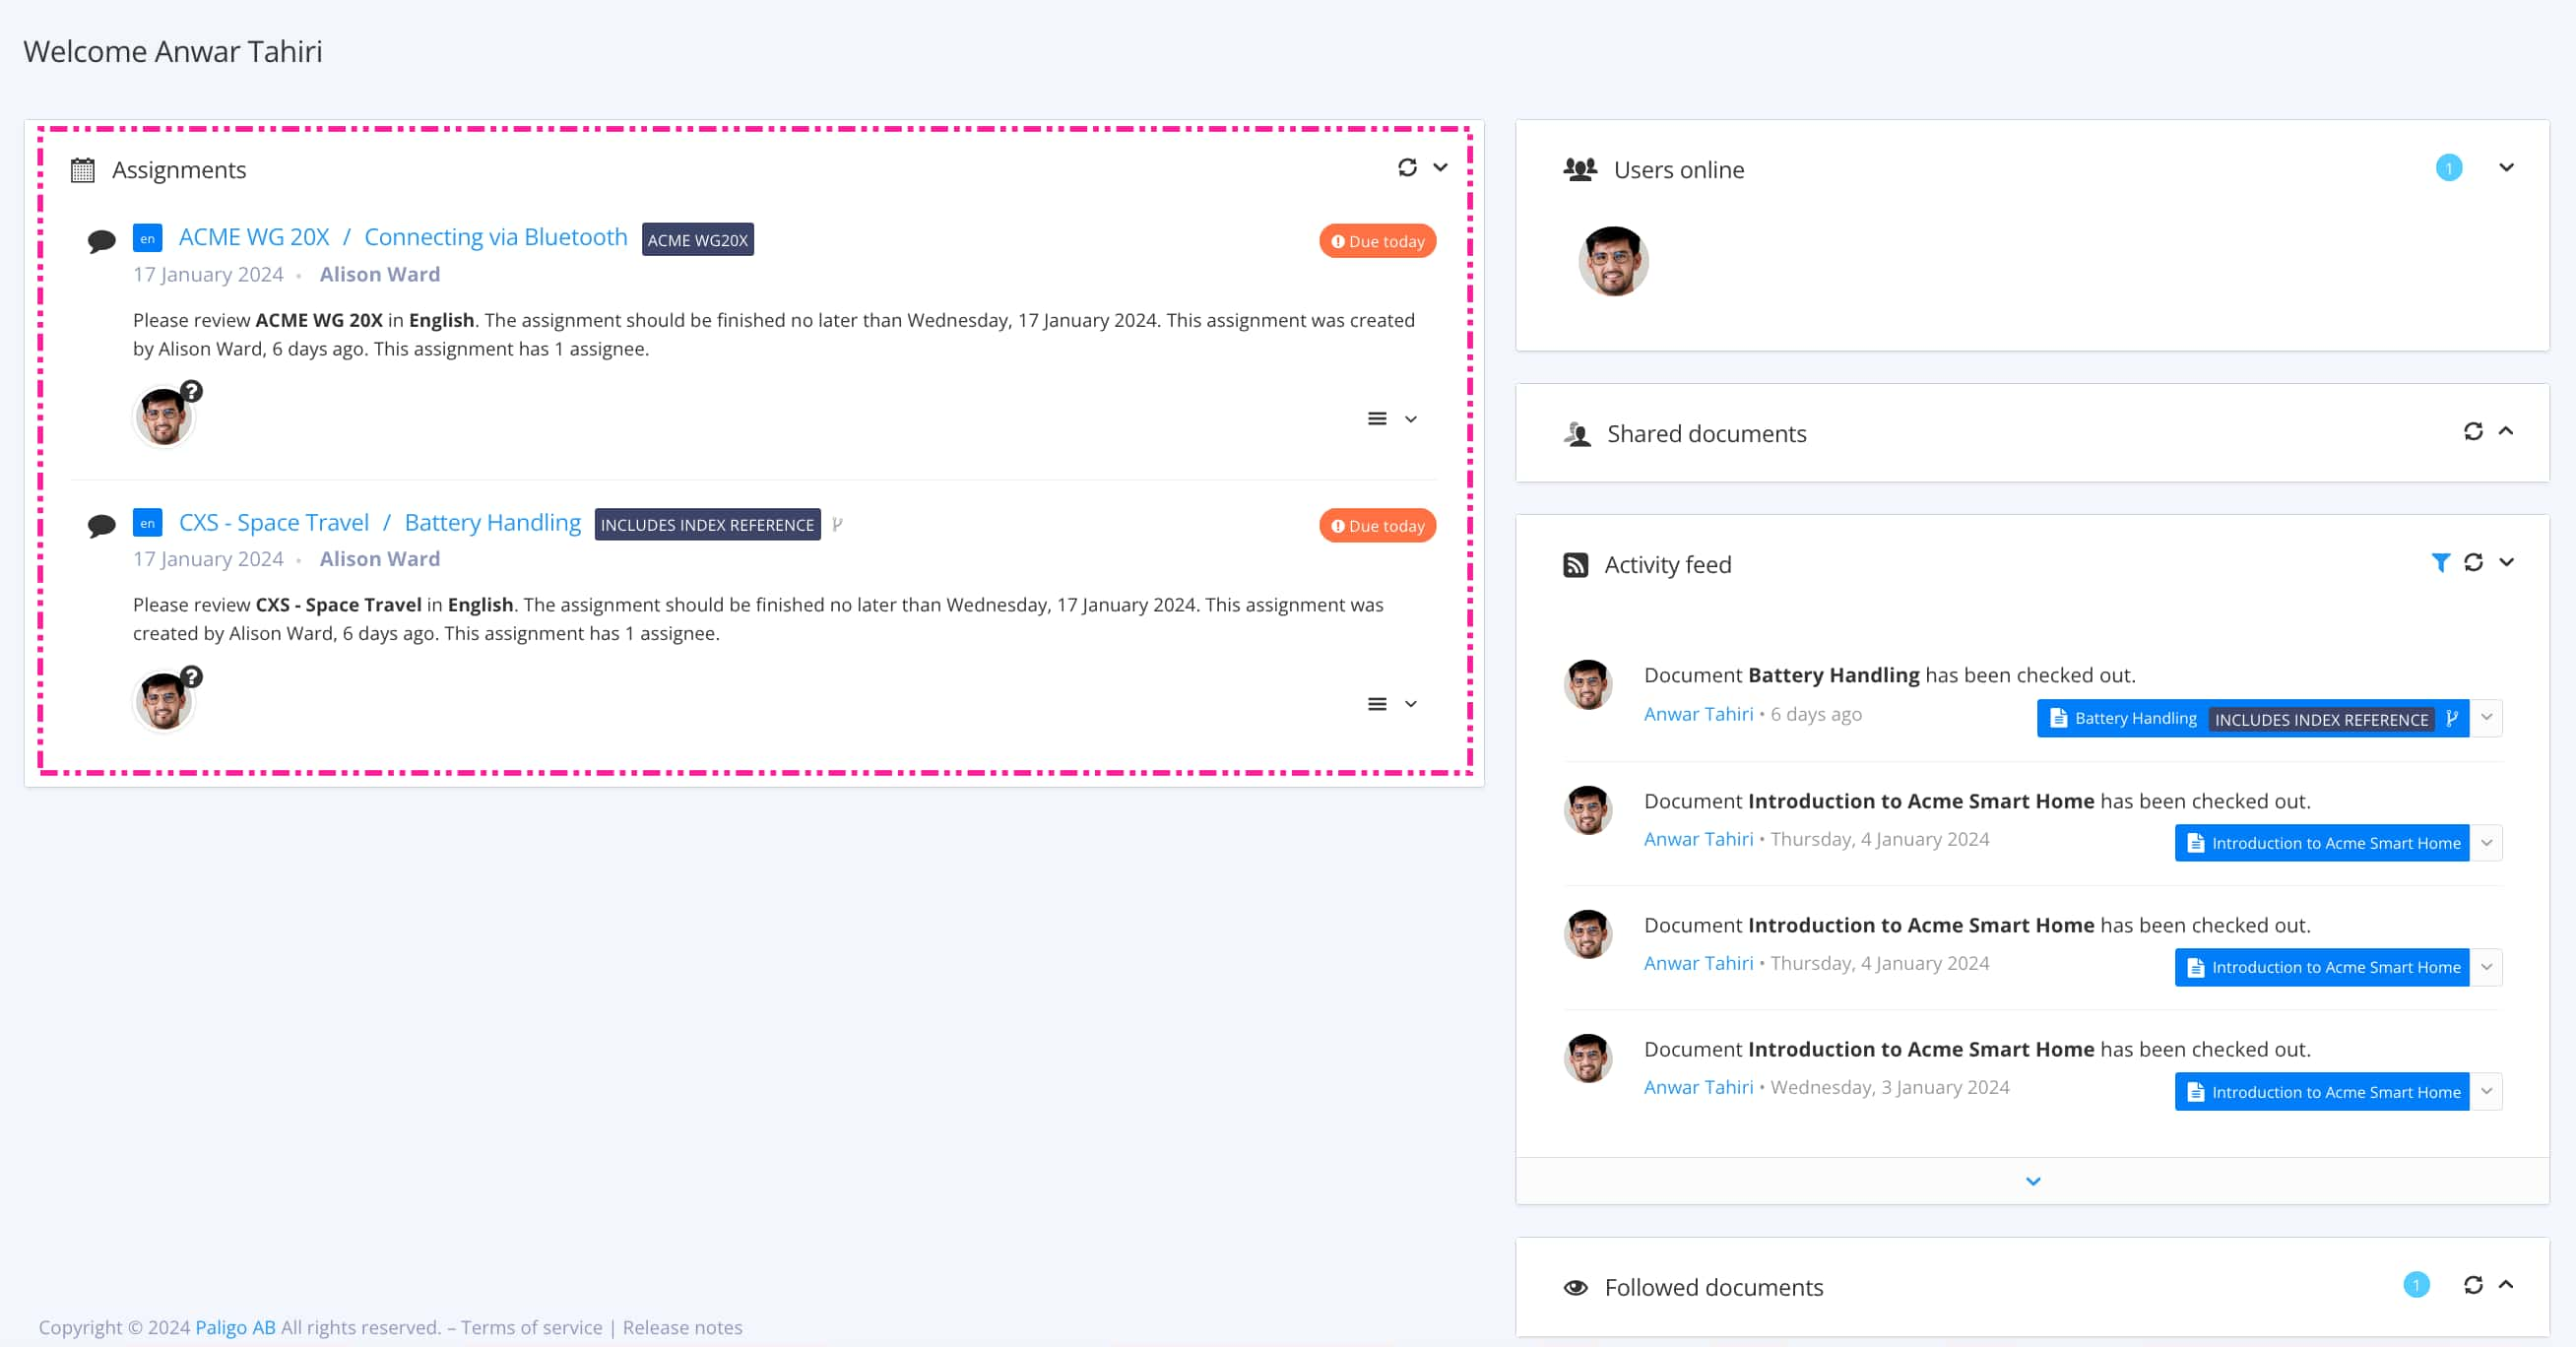
Depending on the user type that logs in, the Assignments Panel appears on the:
Left side of the Dashboard for reviewers and contributors. It shows your current assignments. When an assignment is finished it disappears from the Assignments Panel.
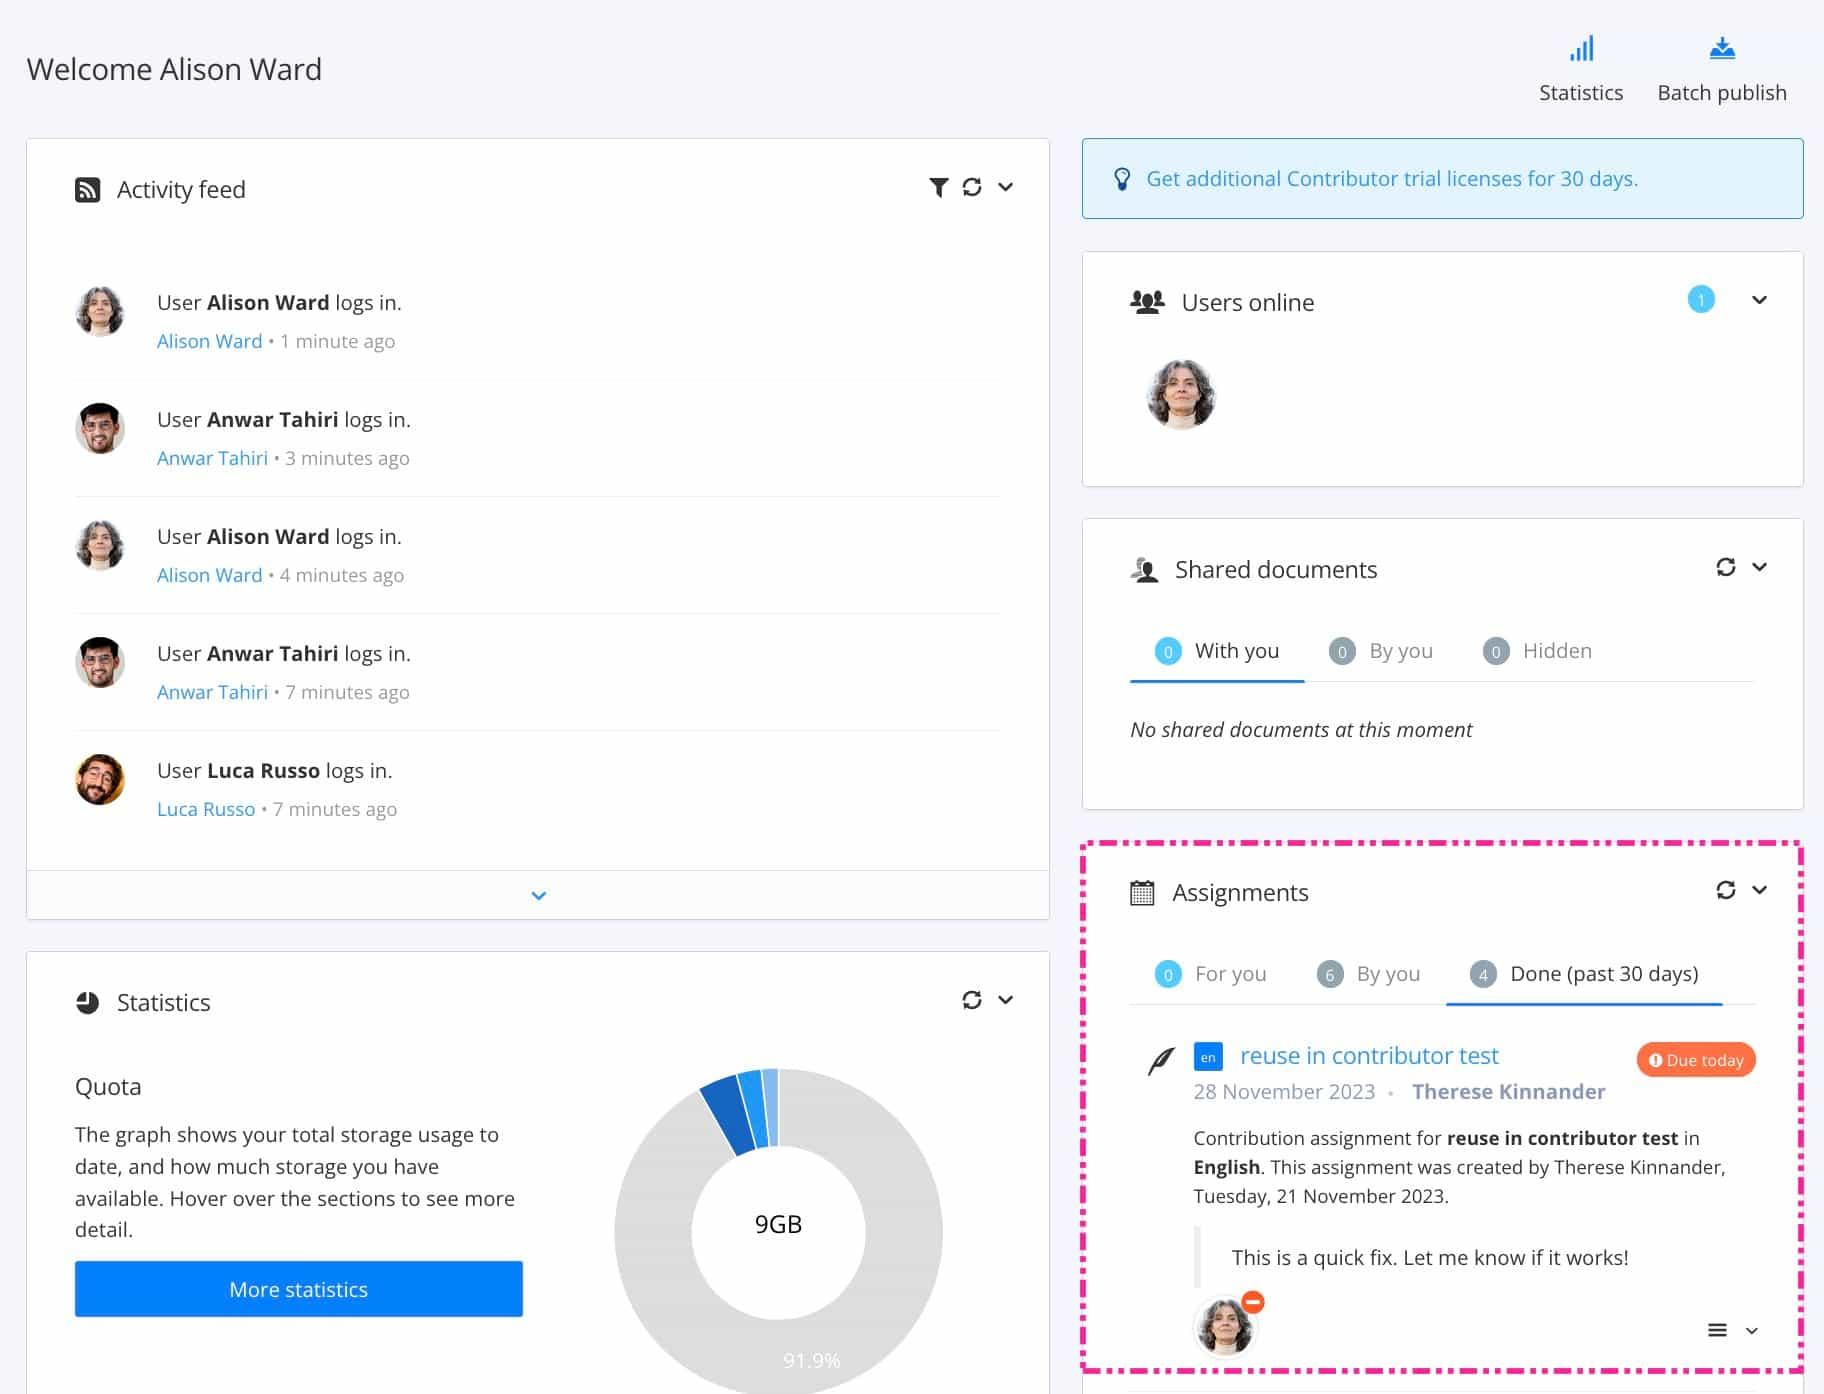
Right side of Dashboard for administrators and authors. The assignments are sorted under the tabs: For You, By You and Done, depending on whether it is allocated to you, created by you, or have been completed by the assignees. By default, the Done tab only displays the assignments done within the last month. If the blue arrow (at the bottom of the Assignments Panel) is selected, all finished assignments are shown.
You can follow the progress from the Assignment Panel and the Planner, see Track the Assignment Progress.
To the left - Assignments Panel for assignees. To the right - Assignments Panel for authors.
Tip
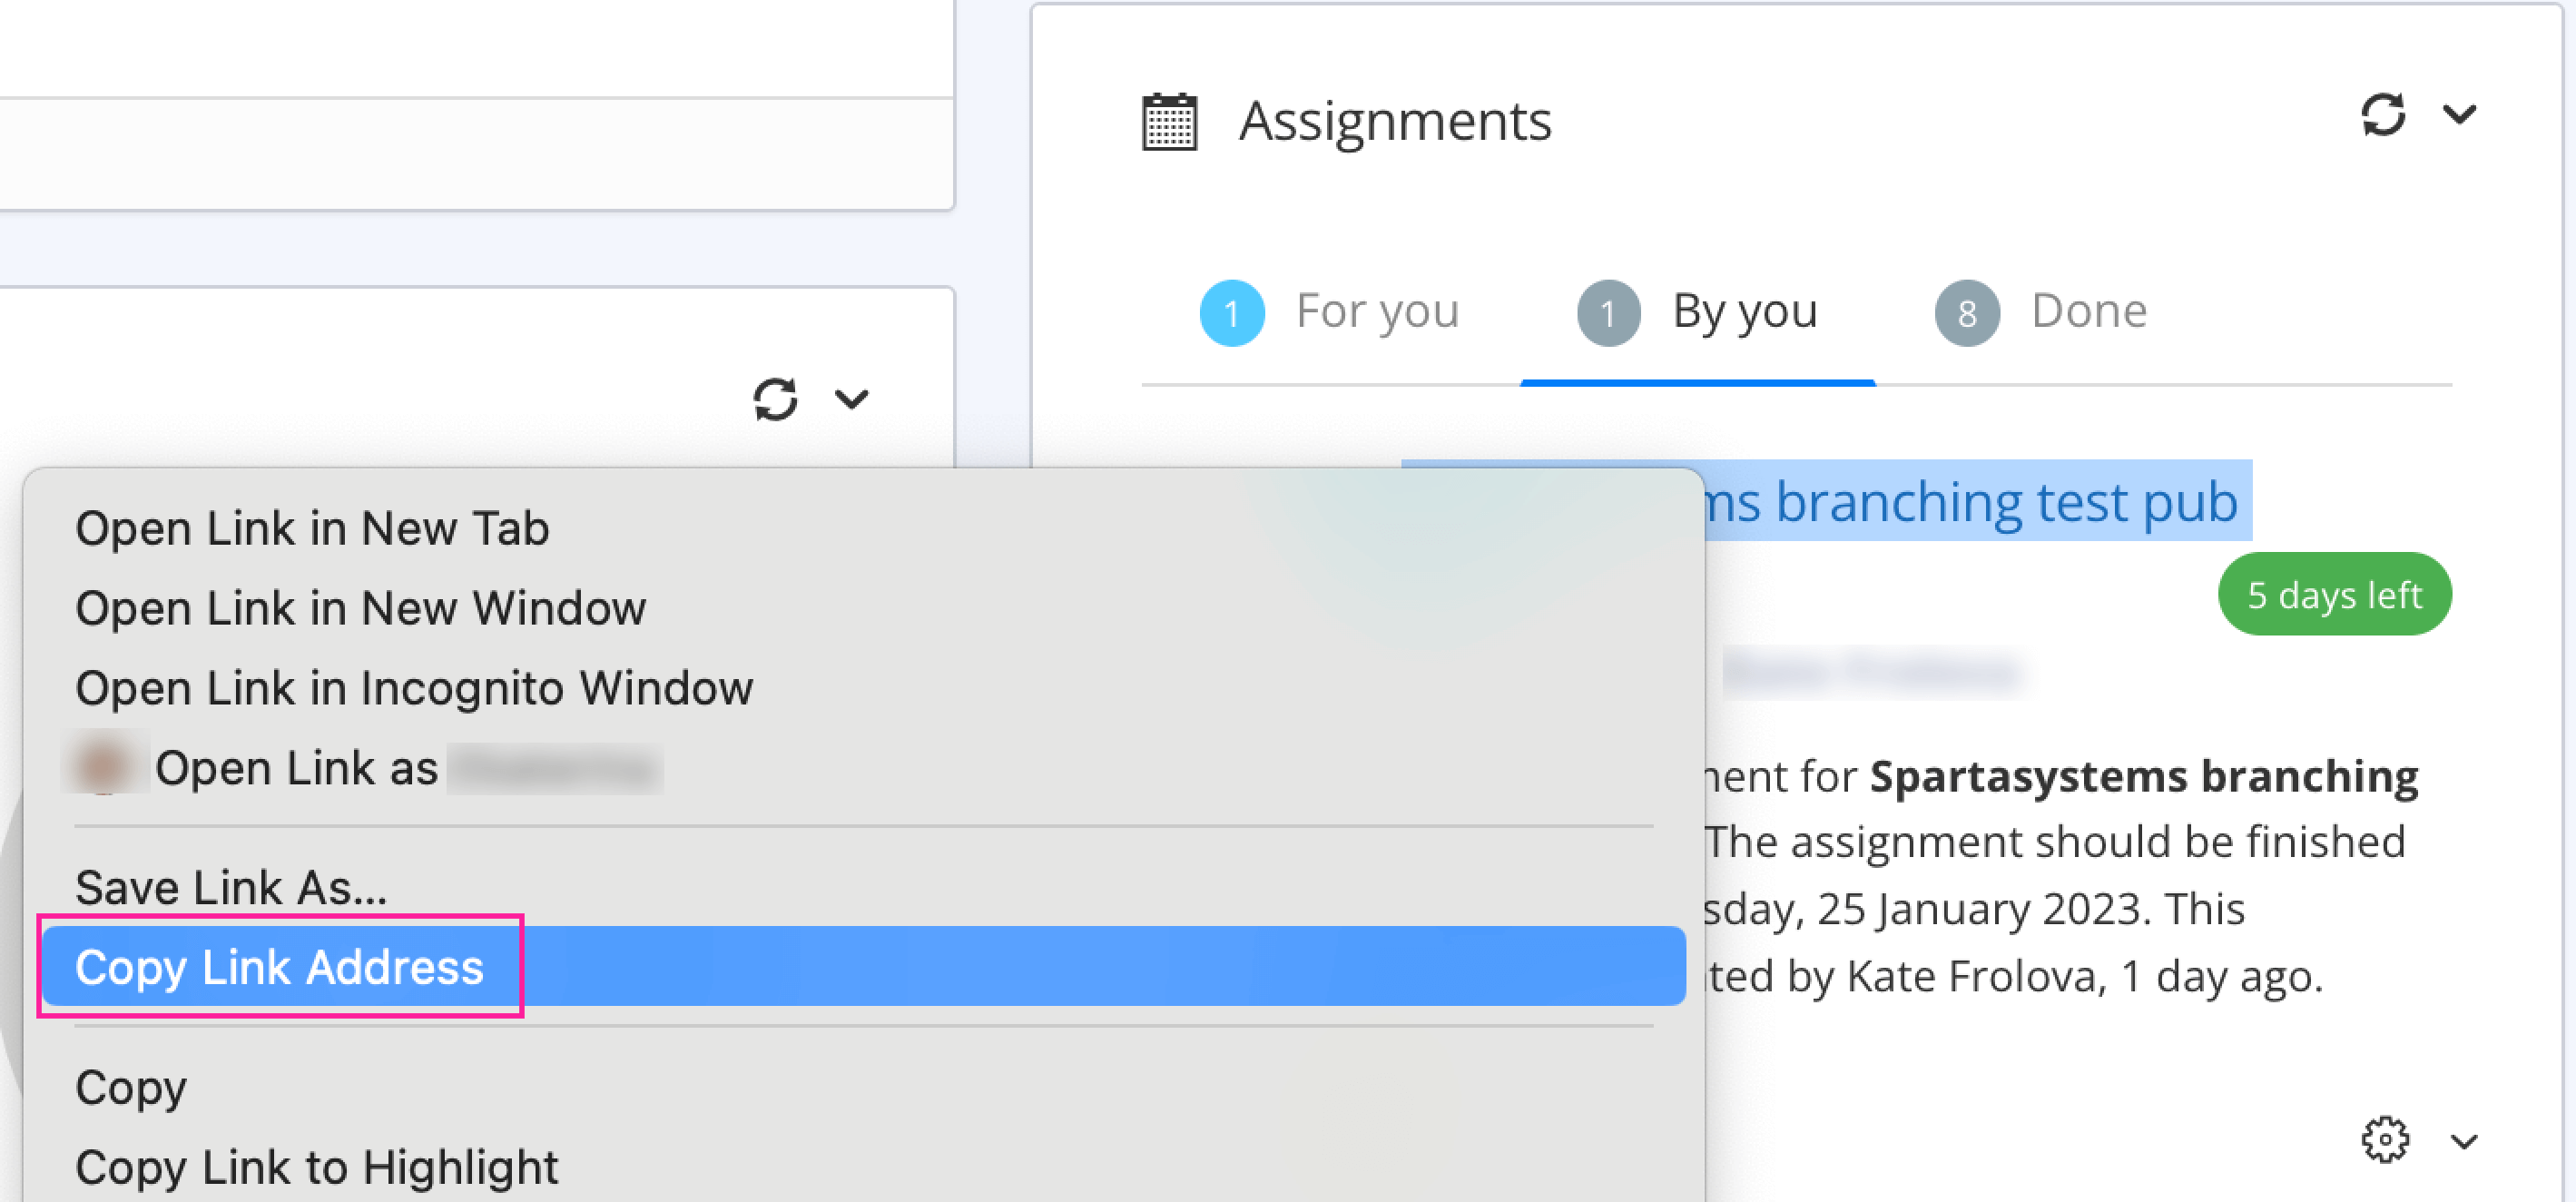
The assignment link is sent to the assignee as an email notification and is also available in the Assignment Panel. If there is a need to copy an assignment link, you can right-click the assignment and choose Copy Link Address.
 |
There is an avatar for each assignee, and it has an icon to show the assignee's response.
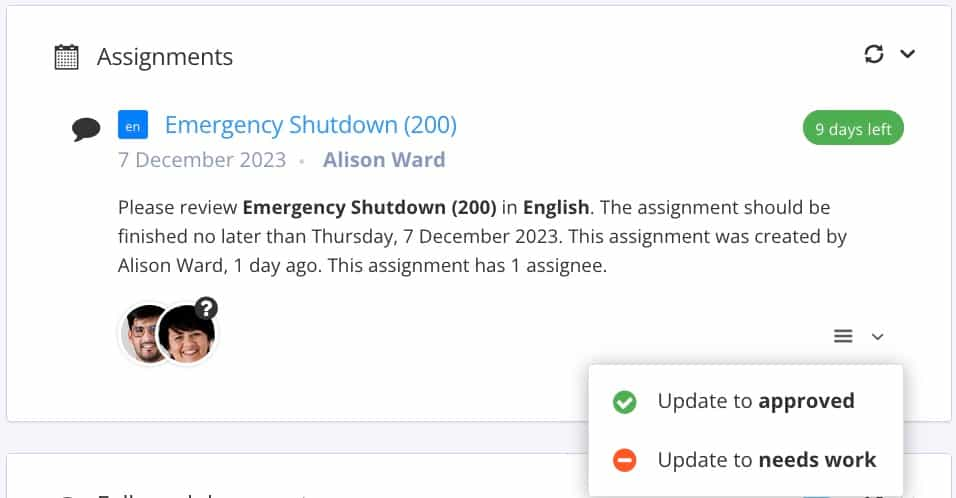 |
| Question mark | The assignee has not responded yet. To be able to remove a former status, choose Reset my status. | |
| Green checkmark | The assignee has finished the assignment and set the content to Approved. Set the status to Update to approved. | |
| Red Minus symbol | The assignee has finished the assignment and set the content to Needs work. Set the status Update to needs work. For translation assignments, "Needs work" is replaced by "Declined". |


Tip
To find out more about assignments, see About Collaboration.
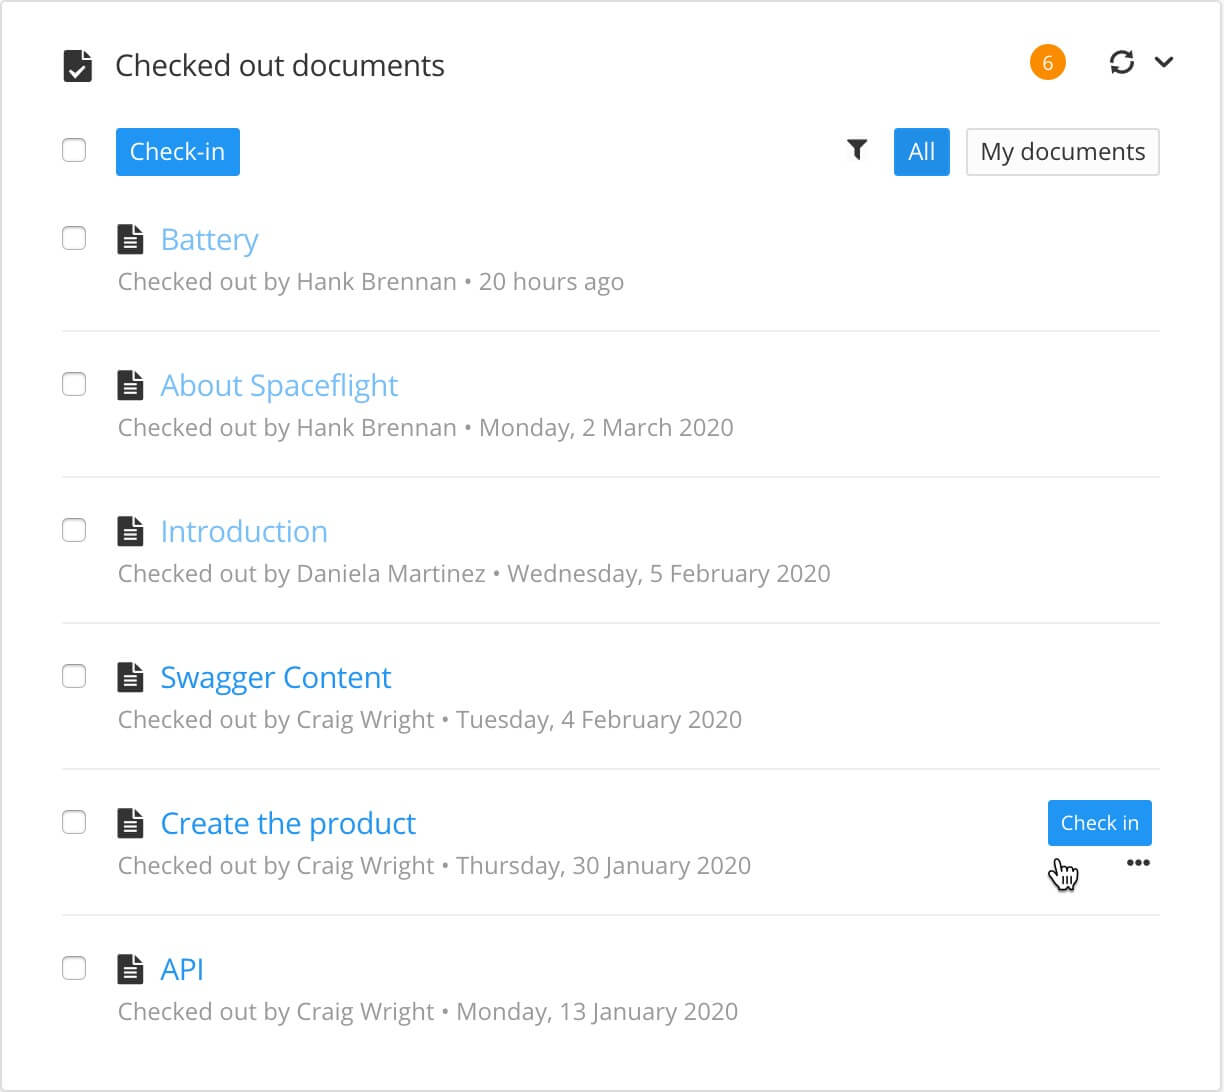
Paligo has a built-in checking in and out system. When you edit a topic, it is checked out automatically, so that other users cannot edit it at the same time. The Checked Out Documents panel gives you a list of documents that are currently checked out.
You can use the Checked Out documents panel to view only the documents you have checked out yourself (My documents) or All documents by all users. You can check in your own documents on an individual basis, or you can select the checkboxes and then use the Check-in button to check in all selected documents at once.
 |
Tip
To find out more about checking in and checking out documents, see Check-in and Check-out.
The Statistic panel provides an overview of your Paligo instance, including the number of publications, topics, and images, and the percentage of reused content.
Display the Statistics Panel
There are two ways to display the Statistics panel:
Select the Statistics option in the top menu.
On your Dashboard, scroll down to the Statistics section and then select More statistics.
Statistics Insights
When you display the Statistics panel, it shows the Insights tab by default. But there is also a Reporting tab, see Statistics Reporting
The Insights tab consists of several rows of information.
The top row shows the total number of publications, topics, images, and languages used.

The second row has data “donuts”.
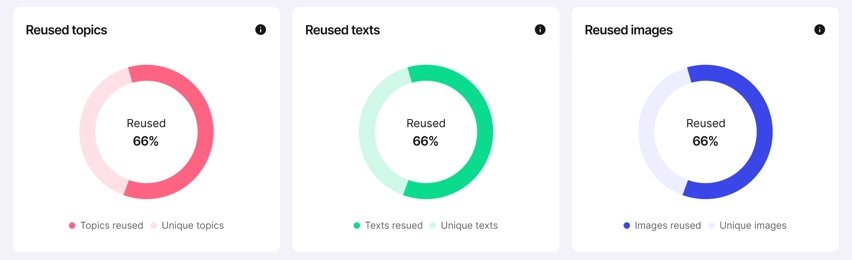
The “donuts” show:
Percentage of reused topics and percentage of unique topics. Unique means not reused in this context.
Percentage of reused texts and percentage of unique texts.
Percentage of reused images and percentage of unique images.
For topic and image reuse, the higher the number, the more efficient your content is likely to be, as repeated information is reused instead of duplicated. But for text fragments, even a relatively modest percentage can be an indicator of good reuse as most databases will have large amounts of text fragments.
The final row has two panels: Topics and Images.
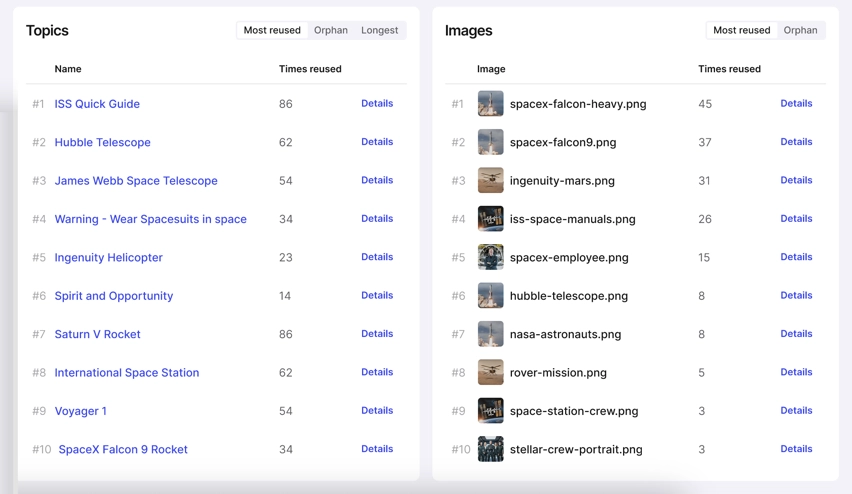
The Topics panel has these tabs:
Most reused
Shows the ten topics that are reused the most in your Paligo instance.
Orphan
Shows ten topics that are orphans.
An orphan topic is a topic that is NOT:
Used in a publication
Inserted into another topic as a component.
Paligo shows the top ten based on alphabetical order.
Longest
Shows the ten topics with the highest word count.
The Images panel has these tabs:
Most reused
Shows the ten images that are reused the most in your Paligo instance.
Orphan
Shows ten images that are orphans.
An orphan image is an image that is not used in any topic or component.
Paligo shows the top ten based on alphabetical order.
In both panels, each entry has a Details link. Select the link to navigate to the Resources view of the folder that contains the topic or image.
Statistics Reporting
Select the Reporting tab on the Statistics page to display the report graphs and access the Export to CSV option. The graphs show data trends over a period of 30 days. We explain how to use the Export to CSV option in Download a Statistics Report (csv file).
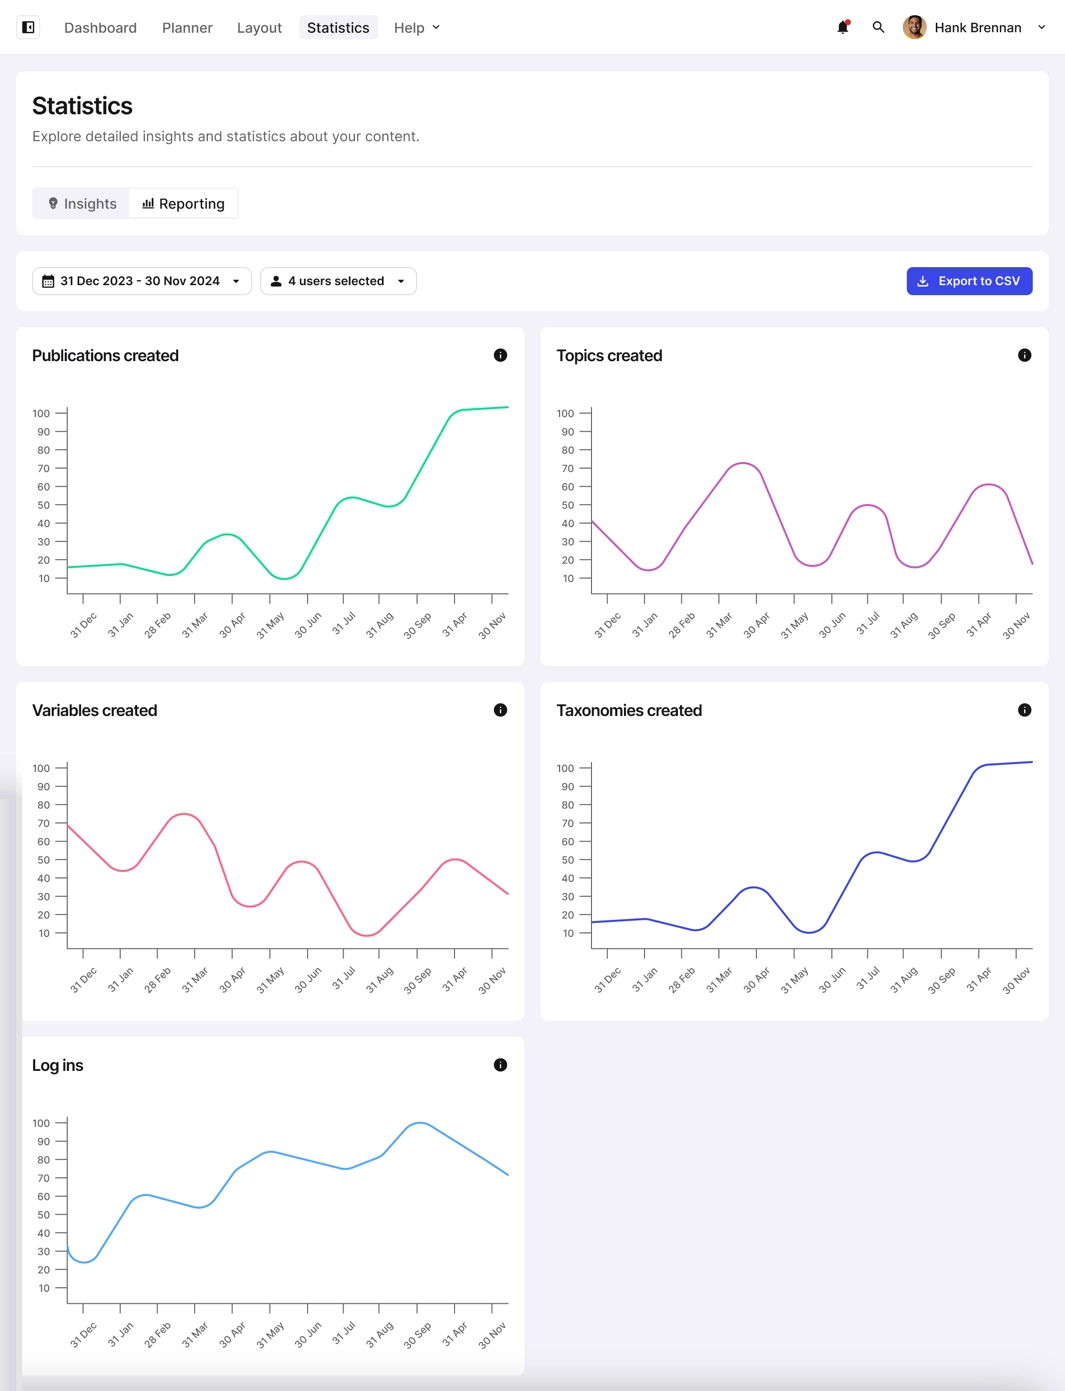
There are graphs for:
Publications created
Topics created
Variables created
Taxonomies created
Sign ins
On each graph, the Y-axis has a range of values, where the maximum value is the current highest value in your instance. For example, if you have 5000 topics in your instance, the maximum range on the Topics created graph is 5000. The X-axis represents a time scale of 30 days.
Note
Be aware that if there are unusual spikes in the trend data, two common causes for this are:
Someone imported a lot of content into your Paligo instance
Someone has deleted a lot of content from your Paligo instance.
Download a Statistics Report (csv file)
If you need to use the statistic data in another system or document, download the statistics as csv (comma separated value) files.
Select Statistics to display the Statistics panel.
Alternatively, display the Statistics from your Dashboard.
Select the Reporting tab.
Select Export to CSV.
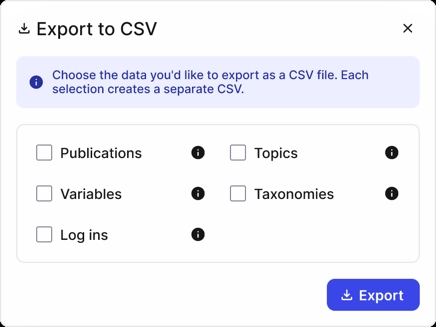
Paligo displays the Export to CSV dialog.
For each category of data report:
Check the box for each statistics csv file you want to create. Paligo will generate a separate csv file for each type of data.
Clear the box to prevent Paligo for generating a csv file for that particular category of statistics.
Select Export.
Paligo generates the csv files and they download in your browser (as a zip file).